


IS YOUR SYSTEM EXPERIENCING HIGH CPU use, memory faulting, poor response time, high disk activity, long-running batch jobs, poorly performing SQL or client/server or Web requests? Are you about to spend thousands of dollars on more memory, faster disk drives, or other upgrades? Before you do, make sure you know why you're having performance issues. A couple of days gathering data from your system and analyzing it from the highest level down to individual lines of code is time well spent - and will likely yield a result you may not have considered. New hardware may have little, if any, effect on system responsiveness, because the root cause of 90 percent of all performance issues is excessive I/O in one or more applications on your system.
This white paper will focus on part of the process of identifying and solving the root causes of these application performance issues. The sample data was collected using a toolset for the iSeries from MB Software called the Workload Performance Series®. It collects data from a system and presents it in a way that lets you analyze your environment from various perspectives and different levels of detail. The data is gleaned from a real analysis of an actual system, so it accurately reflects what you might expect to find in your own environment. But regardless of whether you use the Workload Performance Series or another data-gathering solution, what's important is how you use the data to address the root causes of performance issues within your environment.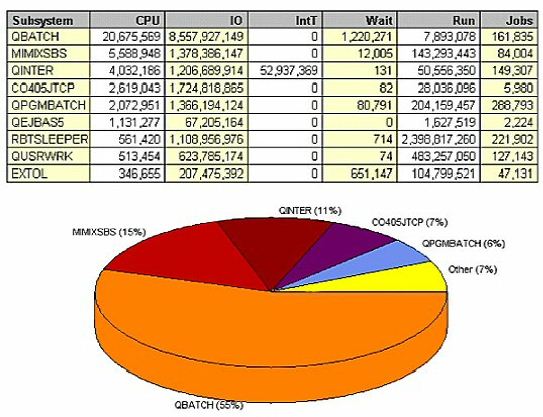
Subsystem Analysis
First, look at a high-level view of what's going on in your system. View CPU use by subsystem. This particular system had significant response time issues, and when we look at the data over a 24-hour period, we find that QBATCH consumed 55 percent of the CPU on this system. MIMIXSBS consumed another 15 percent, and QINTER took 11 percent. Typically, we find that a one-to-one relationship exists between CPU use and I/O performed, and the subsystem that consumes the most CPU also performs the most I/O. We explore this relationship in more detail later on; but if we can reduce these 8.5 billion I/Os, we're going to improve the duration of jobs, consume less CPU, experience better response time, less memory use, less memory faulting, and less disk activity.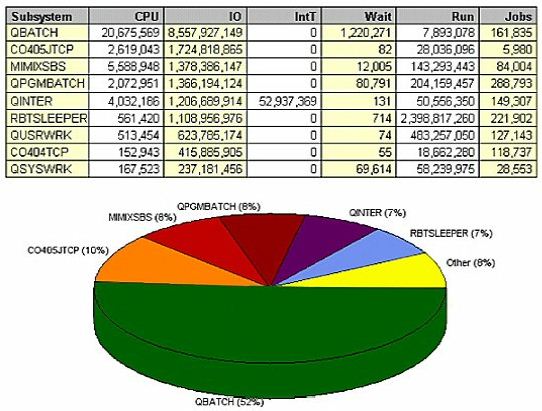
Physical I/O is one of the slowest things on a box, relative to accessing data that's already in memory or being used internally in your programs. We want to block data as efficiently as possible, so whenever disk arms are physically going to disk to retrieve data we want to make sure its being done with the fastest disk drives, the most disk arms, and the newest caching algorithms. But we also want to make sure that we're only performing I/O when absolutely necessary to accomplish a task. Looking at the same data in another way, confirming the one-to-one relationship between CPU and I/O. QBATCH, which was responsible for 55 percent of the CPU consumption, is responsible for 52 percent of the I/O.
On the other hand, sorting the subsystem data by number of jobs shows that more jobs run in the QPGMBATCH subsystem than in QBATCH. Initiating and terminating jobs creates a tremendous amount of overhead, even if the job only takes one CPU second each time it's run. It starts a new job number, opens 15 files, loads 12 programs into memory just to do a tiny bit of work; then it has to remove all those programs from memory, close all the files, terminate the job, and perhaps even generate a job log each time.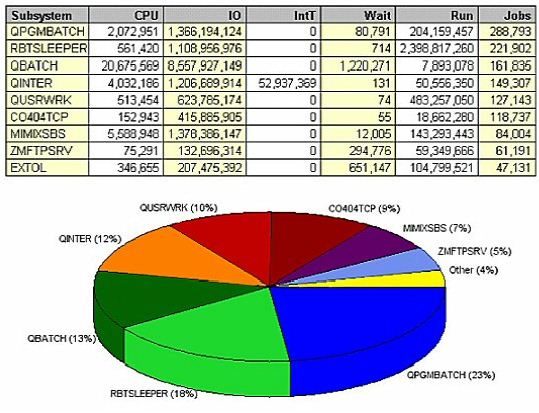
In QPGMBATCH, that happened 288,793 times in a week - that could have been one job sitting in the background, waiting on a data queue. Those files could have been left open, and the programs left in memory; then QPGMBATCH would only be responsible for one percent of the jobs on the system, not 23 percent. In turn, you may have that much less I/O, that much less CPU.
Job Identification
If we look at the same data by job name, we find more areas to drill down into for root cause. (Figure 4) shows 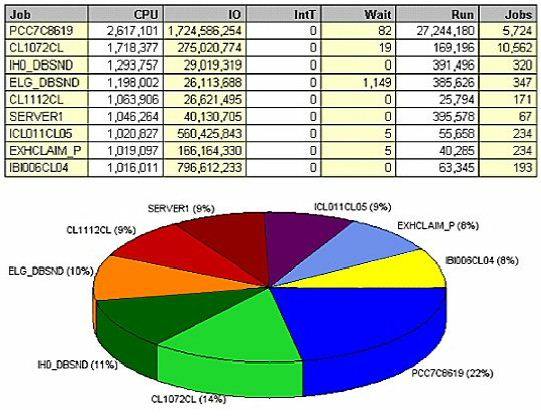
The same job data, sorted by physical I/O (Figure 5), shows that PCC7C8619 also performs the most I/O, clearly 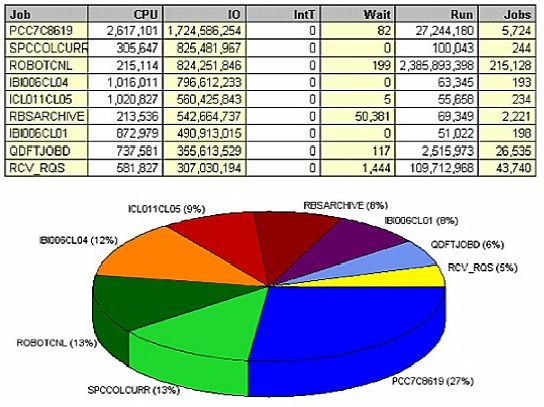
Sorting the data by number of jobs (Figure 6) shows that the jobs running under the name ROBOTCNL comprise 38 percent of all jobs on the system. The QZRCSRVS jobs are remote 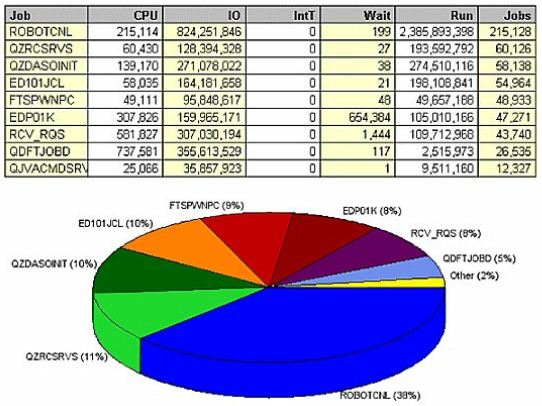
QZDASOINIT is ODBC requests responsible for 10 percent of the jobs on the system. All day long, these job start connections, open SQL requests, do a little bit of work and close the requests. Over and over again, these requests start and stop jobs, open and close files, and load and unload programs into and out of memory.
User Utilization
Typically, we believe that the end user using the WRKQRY command, SQL, or some type of client/server application like MS Access is the performance issue on our box. But when we look at utilization by user we may find that what's being done in operations is actually the culprit. Regardless of what application you're running, or what tools you're using to schedule jobs or replicate data for high availability, you must address the underlying root causes of issues within your environment.
(Figure 7) immediately shows that two user IDs (ROBOT and MIMIXOWN) are responsible for a significant amount of 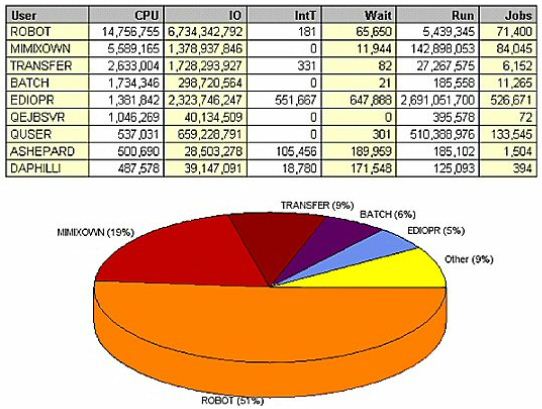
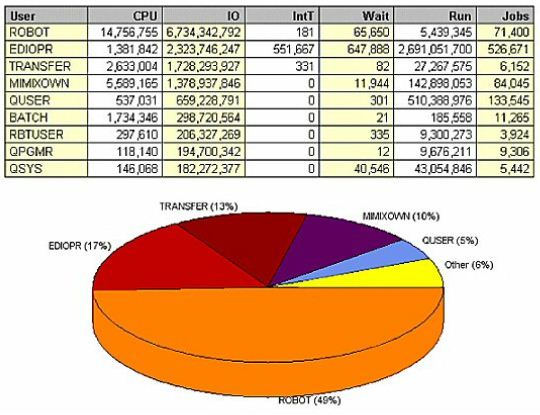
(Figure 9) shows the data sorted by number of jobs, and immediately highlights an area for improvement. Note that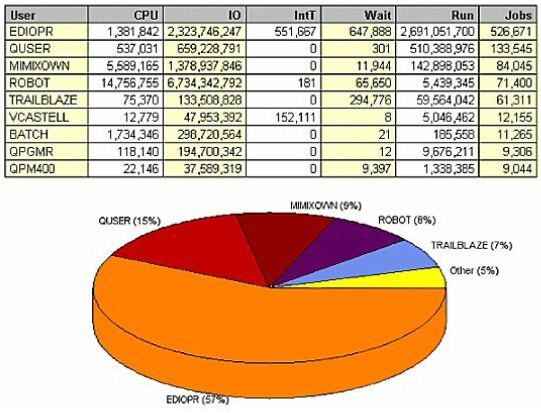
DASD Analysis
Continue drilling down into the data; which files are most often accessed, and which could be archived or even purged? The key thing to remember is that you only want to process the data that will be selected - don't read a million records if you're only going to select 1,000. If you have seven years' worth of history in a general ledger transaction history file, and your accounting users only use it to look for recent transactions to close the books at month's end, you need to streamline that file. Move the old data from the current history file into an archived history file. Don't delete it - it's hard to get users to agree to delete anything. Instead, create a file that has only the last month's data in it for daily use, and move the previous six years' data to an archived file. If you users want current information, they can access one file, and if they want old history (which doesn't happen nearly as often) they can access the other.
(Figure 10) shows that reorganizing database files could help reduce I/O of the applications that access 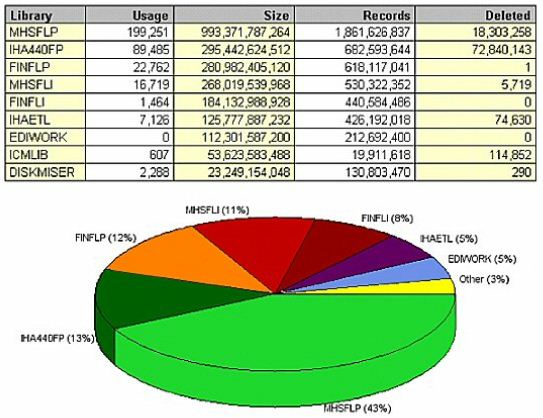
The same data, when sorted by deleted records, shows that library IHA440FP has 700 million active records and 72 million deleted ones (Figure 11). Interestingly, it's not even the main production data library - in fact, it's only a fraction of 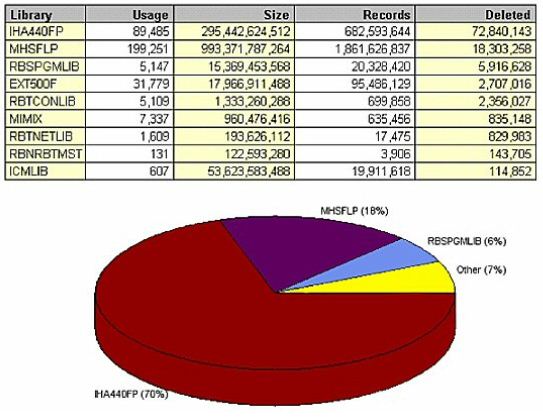
(Figure 12) goes even deeper into the data, to the user level. It shows that user QSECOFR is responsible 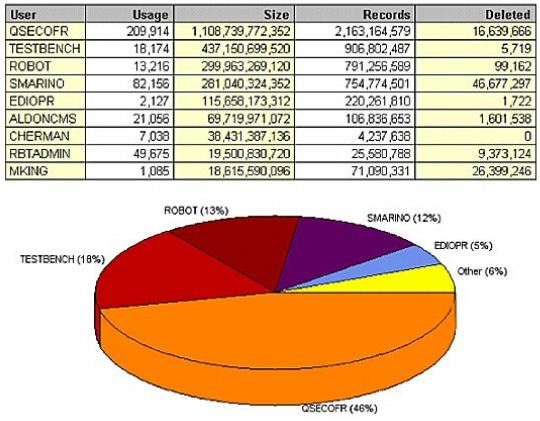
Looking at file size by database name (Figure 13) yields a few surprises as well. The CLMFILESAV file immediately jumps out; this is a save file that's apparently never 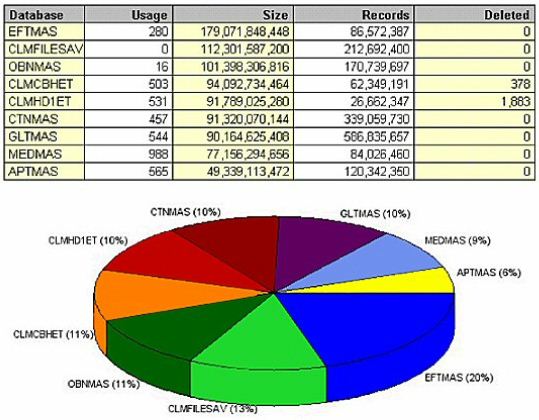
The files on (Figure 14) offer great opportunity for improvement through simple file reorgs. IER200P1 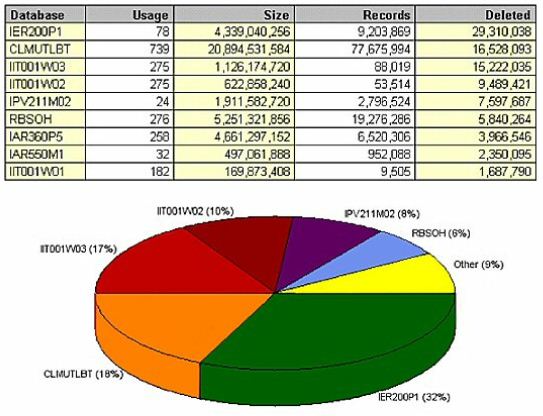
Query Analysis
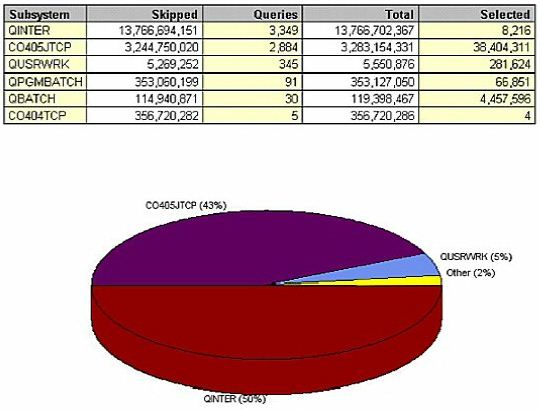
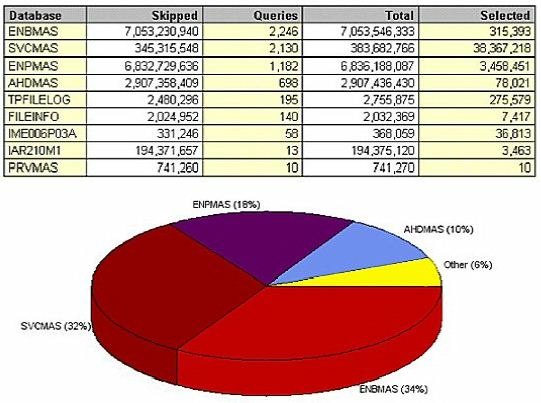
Looking at queries provides an even more detailed level of analysis. This example (Figure 15) shows the system during normal business hours. QINTER had 13 billion skipped records; 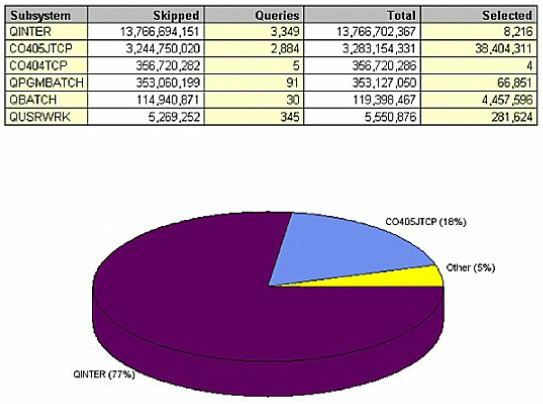
This example is particularly bad. In one day, users performed a total of 3,000 queries - which resulted in 14 billion I/Os - to select 8,000 records. This seems like a ridiculous example, but it's real. This invisible use of resource occurs every day in many environments. It's not truly 'invisible,' but it happens so quickly that most people never see it. These 3,000 requests might have appeared only momentarily, and by the time you have refreshed your screen they were gone. The 14 billion unnecessary I/Os could have paralyzed the system from an interactive response time standpoint, but were individually invisible until we analyzed the data this way.
CO405JTCP isn't much better; it performed three billion I/Os via almost 3,000 queries to select 38 million records. However, another issue exists in this subsystem - why is it selecting so much? What in the world are they doing with so many records for each query? This problem results from applications that preload entire data sets into memory, while the user only accesses the first small set of records. When the user pages down, the application accesses the next page of data out of memory. From a coding perspective, it's much easier to preload 10,000 records into memory and let the user page through them; from a performance perspective - with hundreds of simultaneous users - it's deadly. For system performance, it's worth the additional time and effort to code the application properly - the application should read 10 records at a time, and not a single record more. When the user pages down, read 10 more records. It's horribly inefficient to load 10,000 records into memory that the user will never even think of reading.
Let's look at it another way (Figure 16), sorted by records selected. Remember CO405JTCP? Not surprisingly, it accounts for 89 percent of all of the 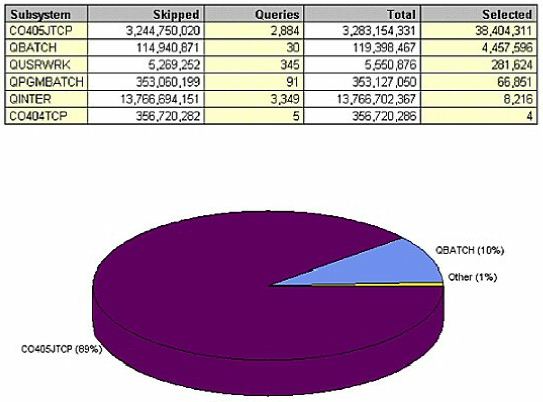
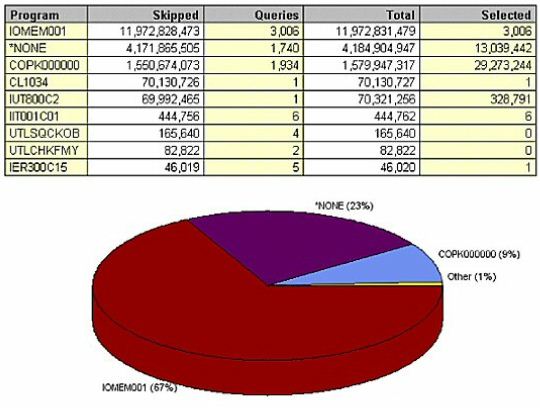
(Figure 18) shows the data by job. Remember PCC7C8619? It was our largest CPU consumer, our largest physical 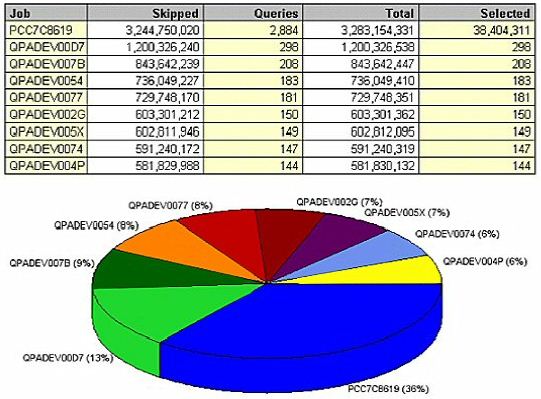
We need to address a few issues here. First, we must make sure that this job has the proper permanent indexes so that it reads 38 million records instead of 3 billion. Next, we should find out why it's selecting so many records each time.
Finally, we need to ask ourselves, 'Why is it running so many times?' Most likely, you have 15 users throughout the company all wanting a copy of a single report, so they're all running the job individually. It would've been a lot more efficient to run the job once and print 15 copies of that report.
Ultimately, you want to get to the level of detail that shows what database needs tuning. (Figure 19) shows what looks to be the master file (ENBMAS) that can clearly benefit 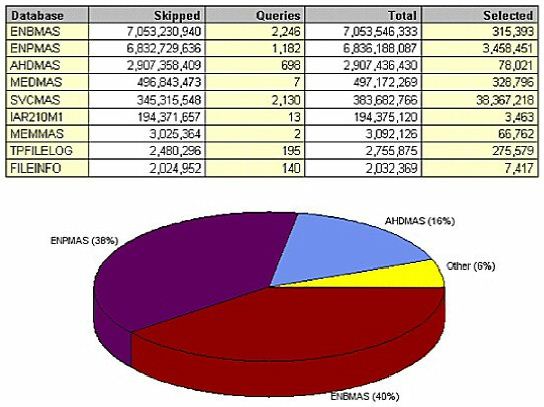
(Figure 20) shows the data sorted by 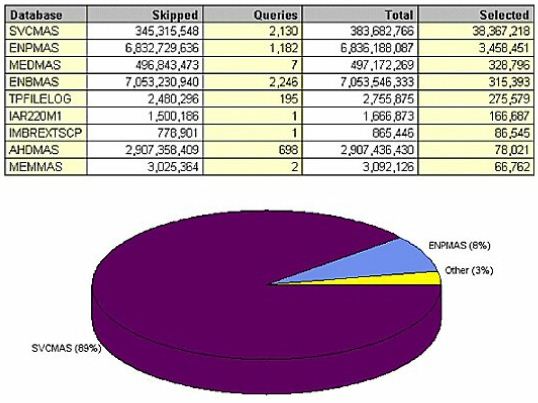
Even beyond the database level is the index level. (Figure 23) seems confusing at first, but it's saying this: if the file ENPMAS had a new permanent logical file keyed by 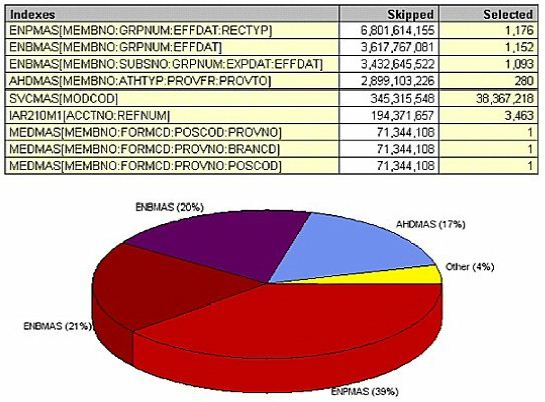
(Figure 24) sorts the query data by selected records. SVCMAS is another master file that's missing an index key by MODCOD. Because of that there is 10 times more I/O than is 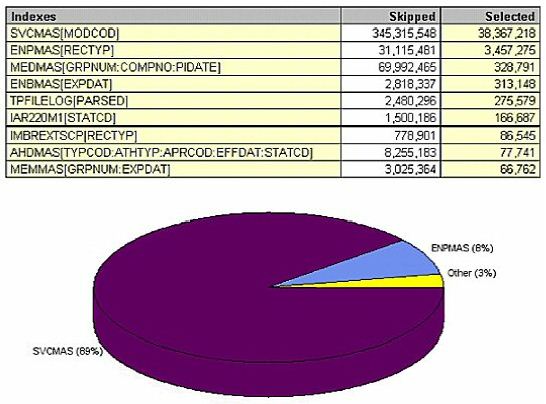
Use Good Judgment
This white paper focuses primarily on SQL-related issues. You also may have code issues with your RPG, Cobol, CL, or C code. Or, you may have 2 GB of journal receivers per day that your high availability tool is having trouble trying to process. Other MB Software white papers focus on these other areas.
No matter what analysis you do, you must use good judgment. You would never want to build 1,000 new permanent logical files. You have to know when to stop. Look at different periods of time and different samples of data; maybe the numbers vary dramatically during month end, weekend or day end processing. Look at the data during a variety of key business times, and correct the issues that will have the greatest impact on your system.