


Many factors affect the performance of your System i and iSeries servers. Lack of sufficient CPU processing power is the most obvious. Memory faulting or an inadequate amount of memory can be equally important. There may be disk I/O bottlenecks on your system that leave CPU and memory resources under utilized. Maybe your application software has inherent performance issues that have nothing to do with system resource or capacity constraints.
Monitoring interactive response times and durations of long running batch jobs can highlight areas of concern. Keeping a close eye on system resources and tuning opportunities can provide optimum performance on existing hardware.
Most systems are I/O bound. As data volumes continue to grow, the performance of an application with poor data access methods only worsens over time. You can easily identify problem jobs or timeframes of concern on your system using various IBM commands including: WRKACTJOB, WRKSYSACT, WRKSYSSTS, WRKDSKSTS and DSPLOG.
Using these commands, you can identify specific constraints on the system. If your CPU utilization spikes to 100% for several hours throughout the day, we then know that we either need more CPU or we need to make the application use less CPU. You may find significant memory faulting occurring during your critical batch processing window. We either need to allocate more memory to your batch subsystems during this processing or the processing needs to require less memory. The disk drives on your system may experience periods of time with a high '% busy'. This would indicate severe disk I/O contention on the system. Your hardware either needs to support faster I/O or your application needs to get the job done with less I/O.
It takes a lot of hardware for an application to read a billion records to only select a thousand records. CPU usage will spike, memory faulting will occur, disk activity will be elevated, jobs will run long and interactive response times won't be at acceptable levels.
Why is my CPU only 20% consumed and my batchjob still runs for 5 hours?
The job or your entire system is I/O bound. The CPU is sitting idle waiting for data off from disk. Memory is under utilized due to poor caching of data. The job is likely performing millions if not billions of logical I/Os to retrieve its data for processing. Most applications do a fairly good job of adding, updating and deleting records from your database files. They do a very poor job of reading only the necessary records for processing. Better database tuning for an SQL based application or more efficient keyed database access for your RPG or COBOL application might be just what is needed.
If your system has 5 processors and this job consumes 20% of the CPU, it is consuming 100% of 1 processor. Single-threaded jobs only use 1 processor at a time.
What types of system bottlenecks should we monitor on a regular basis?
- overall system CPU utilization, average CPU percentage for top CPU consuming jobs
- memory faulting
- disk percent busy
- DASD utilization
- batch job queue wait time
- average interactive response time
- duration of critical nightly batch processing
- SQL, client/server and web application performance
Once bottlenecks are found, what can be done to improve performance besides buying more hardware?
When it comes to I/O constraints, numerous things can be done on your system without the need for more hardware. You may need to do some database tuning to reduce the I/O performed by your SQL or query based application. You might need to optimize the use of operating system journaling to improve I/O performance.
Your batch processing could be generating thousands of pages of spooled files that are not being accessed by any end-users. You may have transaction history database files on your system that have not been purged or archived in 12 years. Numerous batch analytical reporting jobs may be running during peak business hours rather than being scheduled for off hour processing.
The Workload Performance Series software and its integrated System Navigator tool consolidates much of the data mentioned earlier into a single set of online analytical screens. The numerous IBM commands needed to access the core system monitoring information can lead to a very 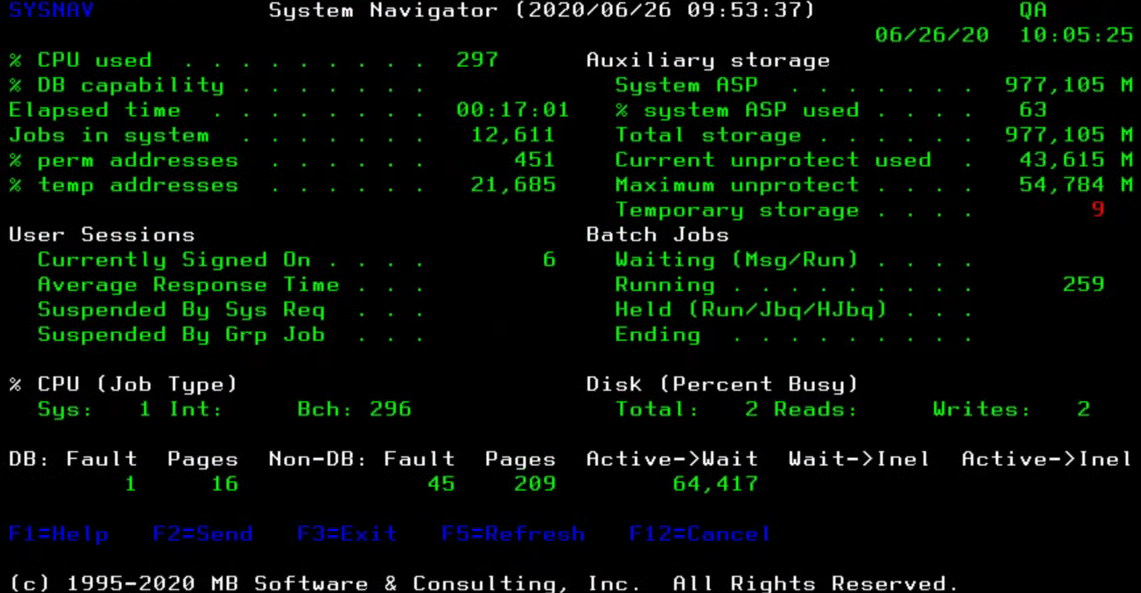 tedious and time consuming process. They also tend to require a person to be 'glued' to a terminal to constantly look for and catch issues.
Historical system and job level data is captured so that you can perform analysis on the data 'after the fact'. You can spend your time resolving consistent issues rather than wasting time searching for the bottlenecks on the system 'right now'.
There are new integrated 'Automated Alerts' features in this version of the software that allow you to define specific thresholds for each of the data elements shown here. You can define a 'Rising' and a 'Falling' threshold for each alert with a customized distribution list if desired. These rising and falling thresholds are critical in controlling 'pager flood'. These new features can help dramatically in freeing up your time from watching over the system. You are automatically sent email or text messages only when issues occur but are not inundated with messages as long as you define appropriate thresholds for your environment.
Once alerted that a key system resource threshold has been exceeded, you can then use the online drill-down capability of the System Navigator tool to identify the specific jobs and users that are responsible.
After finding patterns and determining that a more detailed analysis is appropriate, you can use the integrated Query Optimizer, Application Optimizer, Journal Optimizer, Disk Navigator and Spool Navigator tools to get to the root cause of your high-level system performance issues. The necessary detailed analysis and problem solving required will vary dramatically depending upon the nature of the system bottlenecks identified.