


The Application Optimizer might be the most powerful tool within the Workload Performance Series toolset. It is capable of digging into jobs and determining specifically where and why a processing bottleneck is occurring. You might think that you would need source code for your software to make any use of 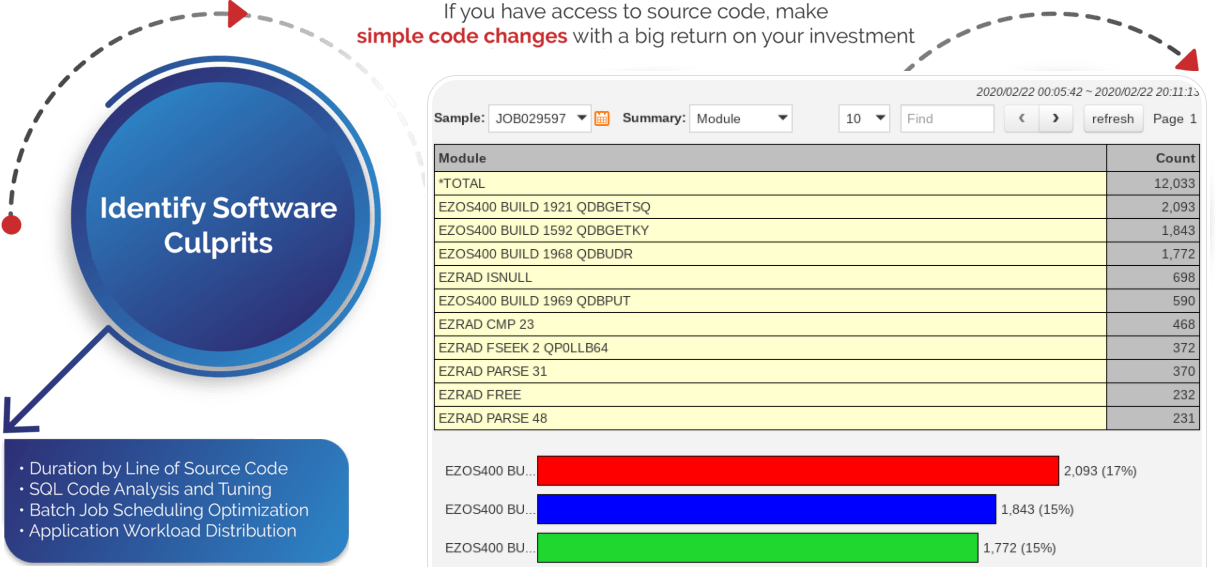 the Application Optimizer tool - this just isn't the case. Sure, having source code is helpful. You can make better use of the Application Optimizer if you have source code and a software developer (or software vendor) that is able and willing to make code changes to improve performance.Even without source code, just knowing where the bottleneck is within the software, can lead to some ideas about how to better use your hardware. The system processor, disk and memory resources can be tuned to accommodate the needs of a job, once those needs are better understood.
The data collection process within the Application Optimizer tool gathers performance statistics on specific jobs at various levels. A 'Job Preview' analysis is a very safe data collection to run on production systems. It collects program, procedure and database file level data at a pre-defined interval. This process defaults to collecting data at 1 minute intervals. Each minute, the data collector looks at the specific job(s) to see the programs and procedures that are currently in use. It counts the number of occurrences of each program and procedure throughout the duration of the job.
After gathering 'Job Preview' information on a long running batch job or on a user's interactive session, you can look at data like the following:
This data can be extremely helpful in determining why a batch job is running long. Also, you might just want a record of the most used programs and procedures within a specific user's interactive sessions:
Any 'problem job' on your system should first be analyzed using the System Navigator, Workload Navigator and Query Optimizer tools. If you know that you are using OS/400 journaling on your system(s), you should use the Journal Optimizer tool to analyze the specific job (or all jobs). The system capacity statistics can be determined while this job is running using the System Navigator. The job level resource utilization can be identified using the Workload Navigator tool. If there is SQL or queries involved, the Query Optimizer might point out some database tuning or SQL changes to make. The job might be updating database files that are journaled. The Journal Optimizer will show the number of transactions by file, program, job, user and transaction type. This data might point out some opportunities to improve performance with some journaling or code changes.
Once all of the higher level analysis has been completed, it's time to use the Application Optimizer. You should ALWAYS start with a 'Job Preview' analysis. While 'Trace Job' and 'Source Analysis' are equally powerful features of the Application Optimizer, they should NEVER be used first! They could dramatically impact the performance of your system or the job during the data collection process. Whenever 'Trace Job' or 'Source Analysis' are used (especially on production systems), you need to use caution. Always monitor the data collection process and terminate it if it is consuming 'to much' resource or if you are ready to go home for the night. NEVER start a 'Trace Job' or 'Source Analysis' on a production system and then just check on it in the morning!!