


The System Navigator is the highest level tool in the Workload Performance Series toolset. This tool captures system level trend data at pre-defined intervals. The default interval is 15 minutes. CPU Peak Analysis, Disk Percent Busy and Memory Faults & Pages are the default views of information within the System Navigator tool. Whether your system or logical partition is experiencing CPU capacity issues, if there is an I/O bottleneck or if memory faulting is an issue - the System Navigator will track system-wide utilization and trend data in an actionable way.
The CPU Peak Analysis features of the System Navigator tool track system CPU utilization by job type:
All CPU consumed by system jobs are shown in red. Interactive job CPU consumption is shown in yellow and batch job CPU is reflected in green. The CPU trend can be very useful on a daily, weekly, monthly or yearly basis to monitor CPU use and track trends. The Workload Performance Series software 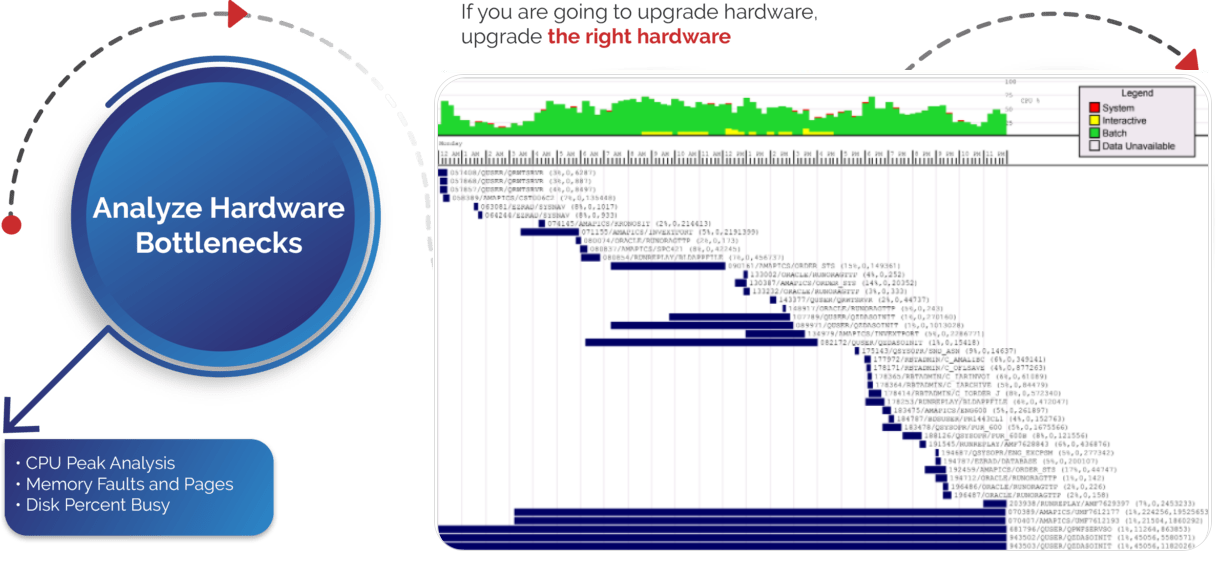 though is extremely helpful in identifying the culprits. In this example, one job was responsible for 55% of the CPU for about an hour and a half. It single-handedly caused the system CPU spike. Let's use Application Optimizer, Query Optimizer and Journal Optimizer to figure out why!
In this example, during the sample period of time, the disk drives averaged out to only being less than 25% busy. Most of the disk I/O coming from 'Writes' versus 'Reads'. The system CPU was not at capacity during this one and a half hour job. The job did perform 557,116 physical I/Os and from the trend portion of the chart, we can tell that most of the I/O on the system at the time was from 'Write' operations.
During the duration of this job, system-wide disk I/O did not seem to be a bottleneck:
It does appear though that there was a significant amount of memory faulting occurring on the system. Memory faults and pages in general were at the highest point of the day. A significant amount of database faults and paging occurring, while this job was running:
Database faults (dbFault) and database paging (dbPages) does seem to be the most significant bottleneck. Non database faults (NdbFlt) and non-database paging (NdbPag) didn't seem to have impacted the job as much. The main conclusion, in this data and using the System Navigator tool, is that this job is performing a significant amount of I/O, consuming lots of memory and CPU in the process. If you focus on the jobs I/O, using Application Optimizer, Query Optimizer and Journal Optimizer, any reduction in I/O will dramatically improve the jobs performance.
This job, like many others, consumes resources performing I/O. If the job is running an SQL request that reads 1,000,000 records to select 1,000 records, then there is clearly area for improvement by doing some simple database tuning. If this job's work file is being inadvertently journalled, making some journalling changes could improve the job. Maybe, Application Optimizer source code analysis would show a specific line of source code of subroutine that needs attention.
The System Navigator tool is the place to start in most environments. From this one set of charts, we get off to a great start in determining the nature of the issues with a particular job. Application Optimizer's source-code analysis, Query Optimizer's table-scan and elapsed time analysis and Journal Optimizers transaction analysis will help find the root case and ultimate fix to issues like long running batch jobs.