


The Disk Navigator can be a great tool for helping you better manage the DASD on your AS/400 and iSeries servers. Equally important is its ability to analyze the 'Disk Activity Statistics' of your servers to determine which database files or applications might need some tuning. From a DASD 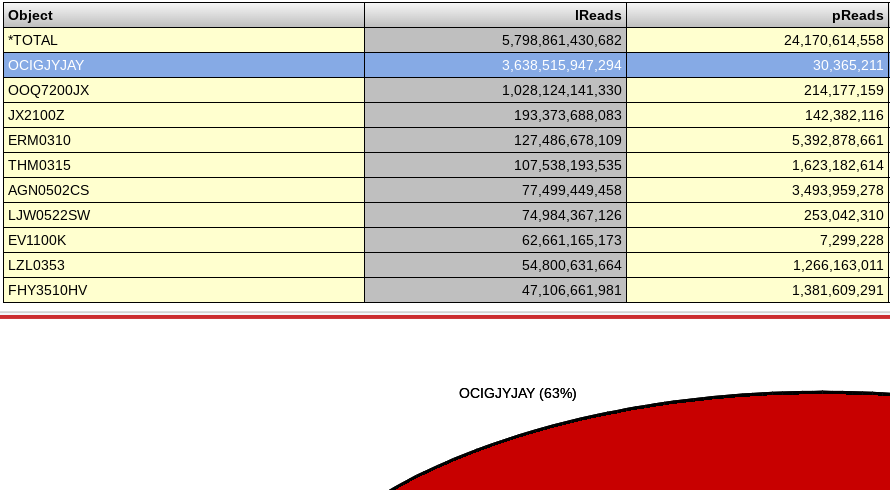 standpoint, the OS/400 native file system and the integrated file system disk storage usage is analyzed. The number of objects are counted and the storage size is accumulated for all objects residing on your servers.
The OS/400 native file system has additional statistics available for each object. The number of active records and the number of deleted records are tracked for each database file on the system. A 'days used' counter is accumulated as an indication of how often an object is used or when it was last used.
This example shows that 1 library is responsible for 29% of the DASD on the system and it contains only 7 objects that were used for a total of 59 days:
The DASD utilization information within the Disk Navigator tool can be accessed at a variety of summarization levels and using various sort sequences. All objects within the OS/400 integrated file system are including in the statistics, with data that is not available left blank. In this example, there were 9,939 objects on the IFS with a total size of 1.3 gigabytes.
The 'Disk Activity Statistics' features of the Disk Navigator can be extremely helpful in improving the overall performance of your AS/400 and iSeries servers. Tracking I/O statistics by database file can help pinpoint specific inefficiencies within your application software. Your software may 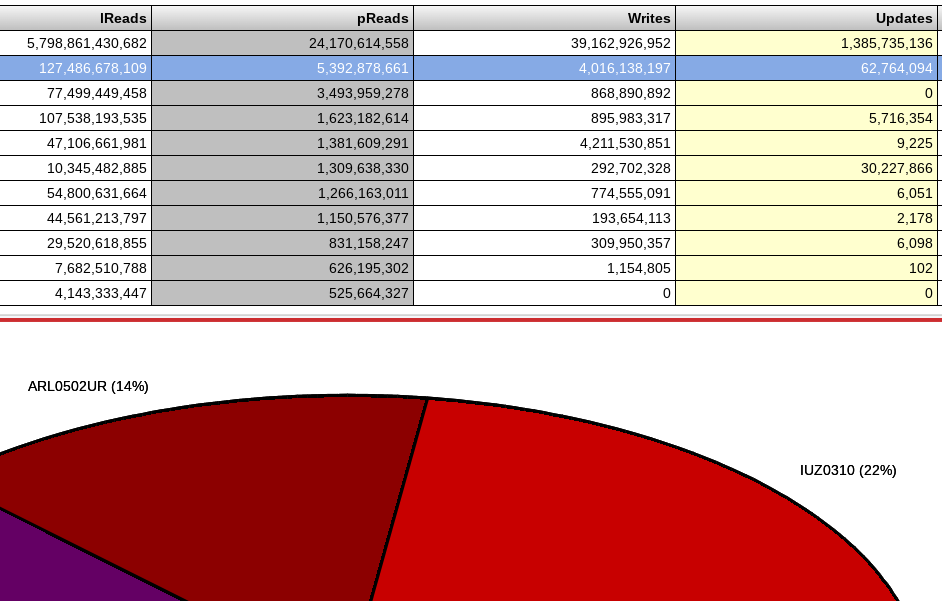 be running SQL requests that are constantly resulting in access path rebuilds. You might have a CL program that uses the 'Copy File (CPYF)' command to subset data into QTEMP. There may be an RPG program on your system that is excessively reading files sequentially throughout the day.
These examples and many more can become evident when analyzing the 'Disk Activity Statistics' on your system:
The first file shown here appears to be doing very poor caching on its reads. 4 million logical reads required 1 million physical reads. The operating system only 'cached' 4 records per physical read. This is extremely inefficient. Having to go to disk to retrieve data is very slow compared to that data already being in memory. The third file on the list only performed 4 physical I/Os to accomplish over 800,000 logical I/Os. This is extremely good caching of data into memory.
There are many uses of this data. These are just some examples of how the information from the Disk Navigator can be used to pinpoint bottlenecks and issues within your application software. You might want to consider using the 'Set Object Access (SETOBJACC)' command to 'pin' certain files into memory during your critical business processing windows. You might want to do some database tuning or make some code changes to improve the performance of your application.